Since 2009 Stefano Mastria has been involved in full-time trading, with an approach based on the principles of Trend Following: a systematic method that exploits large market movements through careful planning and attentive risk management. A data-driven business, with replicable and transferable processes, far from any form of emotional or instinctive trading.

In 2014 the Trend Following Traders Business Community project was born, with the goal of transforming trading from a solitary activity into a collaborative business. The community operates like a hedge fund: traders are trained through structured programs, selected with mandatory tests and placed in working teams to develop and test new ideas and strategies together. Today the community has over 850 users.

Thanks to the integration of artificial intelligence — in particular through Claude Code — it has been possible to develop a proprietary platform with advanced tools directly accessible to members: from the quantitative strategies database to production accounts, from analysis and backtest pages to Power Tools in MQL5, through to PineScript indicators for TradingView. Concrete resources, built internally, that reflect the daily research work of the laboratory.

The figures who have inspired this journey are the great masters of Trend Following and quantitative analysis: Richard Dennis, Ed Seykota, Van Tharp, Joe Ross, Larry Williams, John Murphy, Jack Schwager, Michael Covel and many others.

Research LAB for directional and automatic data-driven strategies, since 2009

Trend Following is based on essential principles: operating on the reality of markets, intercepting and following trends as long as they confirm the presence of supporting liquidity. Markets tend to repeat certain structural behaviours — and it is on these that the operational approach is built. Risky and unnecessarily complex contexts are systematically avoided, favouring clarity, discipline and risk management.

Conti di Produzione a lavoro con Strategie Quantitative e Direzionali

I dati acquisiti giorno per giorno dall'operatività reale servono per migliorare le attività di ricerca, oltre a produrre risultati utili al business

P&L APERTO
1 posizione aperta
+$482
Capitale in gestione
$761.313
Profitto totale
+$3.351 (+0,44%)
📅
Oggi
+$0
🗓️
Settimana
+$8.803
📆
Mese in corso
+$16.776
🗒️
Anno in corso
+$1.950
⚡ Posizioni aperte live (1)
BUY 0.99 lot
+$482
📅
Anno 2025
+$1.401
36 operazioni
📉
Max drawdown
−$3.248 (0,43%)
📊 Storico mensile 2026
+$1.950
📈 Equity complessiva
🏦 Fondi di Produzione (6)
FondoGBP +10,52%
$100.000 → $110.520
Fondo Nettuno -1,46%
$200.000 → $197.086
Fondo Cash-AR Alto Rendimento +0,29%
$100.000 → $100.285
Fondo 5%ERS +0,44%
$57.000 → $57.250
Fondo Marte XauUsd -1,32%
$200.000 → $197.367
Fondo Jedi 500$ 1% -1,20%
$100.000 → $98.805
Aggiornato: 24 Mag 2026 12:09 Sync MT5: 24 Mag 2026 12:07

Directional Trading

A properly trained trader with the necessary field experience is able to manage their activity with high quality and controlled risk. This is the approach developed over time within Trend Following Traders: clear, disciplined, and replicable methodologies.

The Cash-AR 2026 Method is the result of fine-tuning work carried out throughout 2025, designed to operate in a competitive and direct way on the markets. It consists of 5 trading signals and represents the most recent evolution of the directional approach developed within the community.

The most relevant signals are commented on daily on the YouTube channel. Within the community, every member has access to a complete educational path to learn how to operate using the same methods: 6 methodologies consolidated over time, plus the Cash-AR 2026 Method.

Furthermore, within the Community, every user, starting from Trend Following concepts, has the opportunity to create, test, and share their own trading methods.

AI Semi-Automatic Trading

With the support of artificial intelligence — Claude Opus and Claude Code — ongoing research projects are being carried out for the development of Power Tools and Expert Advisors, with the aim of facilitating daily operations and automating certain trading strategies.

The project currently underway involves the development of multiple MQL5 and PineScript tools: support Power Tools for Quantitative trading, Power Tools for quick order management on MetaTrader 5 for directional trading, Power Tools for automating trading on three signals of the Cash-AR 2026 Method — Breakout, Internal Pullback and Pullback in trend — and PineScript indicators for TradingView to support daily technical analysis.

All developed tools, in their subsequent versions, are made freely available to community members to allow thorough testing and improvements over time.

AI Quantitative Trading

The most recent research activity concerns the study and design of quantitative models with the support of artificial intelligence. This is a completely automated approach to trading, in which the trader is exclusively responsible for designing and testing the models, while artificial intelligence carries out the research work. The researcher’s task is to screen the identified solutions until finding the operationally most robust one to bring to the real market.

The central point of this type of trading is the ability to process enormous databases, develop building blocks and money management strategies, and then entrust artificial intelligence with the task of identifying the best configurations for each reference market.

To carry out these activities, the computing power of Amazon AWS, the software StrategyQuantX and the support of Claude Code are leveraged for the configuration of research files and for the development of Power Tools dedicated to the centralised control of strategies in production. The integration of artificial intelligence into this process is enabling significant progress compared to traditional research methods.

🧠 Strategie Quantitative elaborate con Strategy Quant disponibili nella Community
36 strategie · selezione curata
#1 Strategia 1.1.106
✨ NEW Ricerca MM DIN.
⚙️ Ottimizzazione dinamica
200$ DD1% BE+T1000$
DD 1% BE $1,000 TRAIL $1,000
💰 Profitto (con ottimizzazione)
+$556.008
Return: +556,01% su $656.008
GBPJPY Buy & Sell 346 operazioni
📈 Equity curve backtest
2017–2026 · 10 anni
📊 P&L per anno (backtest, rendimento composto)
DD %
−3,32%
R/DD
167,32
PF
8,25
Sharpe
1,80
Win Rate
14,2%
Trades
346
Operativi
0
Ricerca
0
GBPJPY OP M5 ST H1/D1 SL 0.1% · TP 11.3% 24/7
#2 Strategia 1.1.144
✨ NEW Ricerca MM DIN.
💰 Profitto totale (backtest)
+$361.176
Return: +361,18% su $100.000
GBPJPY Buy & Sell 314 operazioni
📈 Equity curve backtest
2017–2026 · 10 anni
📊 P&L per anno (backtest, rendimento composto)
DD %
−14,80%
R/DD
24,41
PF
3,44
Sharpe
1,95
Win Rate
3,5%
Trades
314
Operativi
0
Ricerca
0
GBPJPY OP M5 ST H1/D1 SL 0.1% · TP 11.1% 24/7
#3 Strategia 1.89.136(2)
Test a Mercato MM DIN.
⚙️ Ottimizzazione dinamica
500$ DD1% BE+T1000$
DD 1% BE $1,000 TRAIL $1,000
💰 Profitto (con ottimizzazione)
+$1.376.486
Return: +1.376,49% su $1.476.486
GBPUSD Buy & Sell 168 operazioni
📈 Equity curve backtest
2017–2026 · 10 anni
📊 P&L per anno (backtest, rendimento composto)
DD %
−2,68%
R/DD
512,93
PF
15,62
Sharpe
2,82
Win Rate
32,7%
Trades
168
Operativi
1
Ricerca
1
GBPUSD OP M5 ST H1/D1 SL 0.1% · TP 13.1% 🕐 04:00-12:00
#4 Strategia 1.14.121
Test a Mercato MM FISSO
⚙️ Ottimizzazione dinamica
400$ DD 1%
DD 1%
💰 Profitto (con ottimizzazione)
+$60.626
Return: +60,63% su $160.626
EURUSD Buy & Sell 167 operazioni
📈 Equity curve backtest
2018–2025 · 8 anni
📊 P&L per anno (backtest, rendimento composto)
DD %
−8,63%
R/DD
7,03
PF
1,90
Sharpe
1,95
Win Rate
9,0%
Trades
167
Operativi
0
Ricerca
3
EURUSD OP M5 ST D1 SL 0.2% · TP 4% 🕐 06:00-08:00
#5 Strategia 1.41.121
Test a Mercato MM DIN.
⚙️ Ottimizzazione dinamica
400$ DD 1%
DD 1%
💰 Profitto (con ottimizzazione)
+$220.328
Return: +220,33% su $320.328
GBPUSD Buy & Sell 265 operazioni
📈 Equity curve backtest
2017–2026 · 10 anni
📊 P&L per anno (backtest, rendimento composto)
DD %
−6,53%
R/DD
33,72
PF
4,38
Sharpe
1,90
Win Rate
4,9%
Trades
265
Operativi
0
Ricerca
0
GBPUSD OP M5 ST H1/D1 SL 0.1% · TP 9.4% 🕐 04:00-12:00
#6 Strategia 1.54.157
Test a Mercato MM DIN.
⚙️ Ottimizzazione dinamica
500$ DD1% BE+T1000$
DD 1% BE $1,000 TRAIL $1,000
💰 Profitto (con ottimizzazione)
+$1.991.866
Return: +1.991,87% su $2.091.866
XAUUSD Buy & Sell 236 operazioni
📈 Equity curve backtest
2017–2026 · 10 anni
📊 P&L per anno (backtest, rendimento composto)
DD %
−2,26%
R/DD
882,19
PF
17,75
Sharpe
2,33
Win Rate
37,3%
Trades
236
Operativi
1
Ricerca
1
XAUUSD OP M5 ST H1/D1 SL 0.2% · TP 10%
#7 Strategia 1.55.106
Test a Mercato MM DIN.
⚙️ Ottimizzazione dinamica
500$ DD1% BE&T1000$
DD 1% BE $1,000 TRAIL $1,000
💰 Profitto (con ottimizzazione)
+$1.913.828
Return: +1.913,83% su $2.013.828
XAUUSD Buy & Sell 241 operazioni
📈 Equity curve backtest
2017–2026 · 10 anni
📊 P&L per anno (backtest, rendimento composto)
DD %
−2,26%
R/DD
845,73
PF
16,31
Sharpe
2,55
Win Rate
36,9%
Trades
241
Operativi
2
Ricerca
1
XAUUSD OP M5 ST H1/D1 SL 0.2% · TP 10% 🕐 04:00-12:00
#8 Strategia 1.55.117
Test a Mercato MM DIN.
⚙️ Ottimizzazione dinamica
200$ DD1%
DD 1%
💰 Profitto (con ottimizzazione)
+$433.133
Return: +433,13% su $533.133
XAUUSD Buy & Sell 182 operazioni
📈 Equity curve backtest
2017–2026 · 10 anni
📊 P&L per anno (backtest, rendimento composto)
DD %
−6,63%
R/DD
65,33
PF
7,39
Sharpe
2,27
Win Rate
6,6%
Trades
182
Operativi
1
Ricerca
0
XAUUSD OP M5 ST H1/D1 SL 0.2% · TP 10% 🕐 04:00-12:00
#9 Strategia 1.57.193
Test a Mercato MM DIN. ▶ VIDEO
⚙️ Ottimizzazione dinamica
500$ DD1% BE+T1000$
DD 1% BE $1,000 TRAIL $1,000
💰 Profitto (con ottimizzazione)
+$1.977.994
Return: +1.977,99% su $2.077.994
XAUUSD Buy & Sell 240 operazioni
📈 Equity curve backtest
2017–2026 · 10 anni
📊 P&L per anno (backtest, rendimento composto)
DD %
−2,26%
R/DD
876,06
PF
17,63
Sharpe
2,48
Win Rate
38,3%
Trades
240
Operativi
1
Ricerca
0
XAUUSD OP M5 ST H1/D1 SL 0.2% · TP 10% 🕐 04:00-12:00
#10 Strategia 1.8.131
Test a Mercato MM DIN. ▶ VIDEO
⚙️ Ottimizzazione dinamica
500$ DD1% BE e T 1000
DD 1% BE $1,000 TRAIL $1,000
💰 Profitto (con ottimizzazione)
+$533.596
Return: +533,60% su $633.596
XAUUSD ⏱ H1 Buy & Sell 35 operazioni
📈 Equity curve backtest
2018–2024 · 7 anni
📊 P&L per anno (backtest, rendimento composto)
DD %
−2,78%
R/DD
192,18
PF
22,02
Sharpe
5,42
Win Rate
48,6%
Trades
35
Operativi
1
Ricerca
4
XAUUSD OP H1 SL 0.5% · TP 19.6% 🕐 06:00-08:00
#11 Strategia 1.92.106
Test a Mercato MM FISSO
⚙️ Ottimizzazione dinamica
500$ DD1% BE+T1000$
DD 1% BE $1,000 TRAIL $1,000
💰 Profitto (con ottimizzazione)
+$225.040
Return: +225,04% su $325.040
XAUUSD LONG 191 operazioni
📈 Equity curve backtest
2018–2025 · 8 anni
📊 P&L per anno (backtest, rendimento composto)
DD %
−4,09%
R/DD
55,06
PF
6,42
Sharpe
3,44
Win Rate
21,5%
Trades
191
Operativi
0
Ricerca
1
XAUUSD OP M5 ST D1 SL 0.4% · TP 14.7%
#12 Strategia 1.95.111
Test a Mercato MM DIN.
⚙️ Ottimizzazione dinamica
500$ DD1% BE+T1000$
DD 1% BE $1,000 TRAIL $1,000
💰 Profitto (con ottimizzazione)
+$1.370.364
Return: +1.370,36% su $1.470.364
GBPUSD Buy & Sell 167 operazioni
📈 Equity curve backtest
2017–2026 · 10 anni
📊 P&L per anno (backtest, rendimento composto)
DD %
−2,68%
R/DD
510,65
PF
16,01
Sharpe
2,85
Win Rate
31,7%
Trades
167
Operativi
1
Ricerca
0
GBPUSD OP M5 ST H1/D1 SL 0.1% · TP 13.1% 🕐 04:00-12:00
#13 Strategia 2.39.176
Test a Mercato MM FISSO
⚙️ Ottimizzazione dinamica
200$ DD1%
DD 1%
💰 Profitto (con ottimizzazione)
+$167.698
Return: +167,70% su $267.698
XAUUSD LONG 165 operazioni
📈 Equity curve backtest
2018–2025 · 8 anni
📊 P&L per anno (backtest, rendimento composto)
DD %
−7,40%
R/DD
22,66
PF
5,37
Sharpe
3,42
Win Rate
15,8%
Trades
165
Operativi
0
Ricerca
2
XAUUSD OP M5 ST D1 SL 0.4% · TP 19.8% 🕐 04:00-14:00
#14 Strategia 2.55.123
Test a Mercato MM DIN.
💰 Profitto totale (backtest)
+$158.379
Return: +158,38% su $100.000
EURUSD Buy & Sell 172 operazioni
📈 Equity curve backtest
2017–2026 · 10 anni
📊 P&L per anno (backtest, rendimento composto)
DD %
−13,08%
R/DD
12,11
PF
3,71
Sharpe
2,60
Win Rate
5,2%
Trades
172
Operativi
0
Ricerca
0
EURUSD OP M5 ST H1/D1 SL 0.1% · TP 8.1% 🕐 04:00-12:00
#15 Strategia 3.81.181
Test a Mercato MM FISSO
⚙️ Ottimizzazione dinamica
600$ DD1%
DD 1%
💰 Profitto (con ottimizzazione)
+$176.599
Return: +176,60% su $276.599
XAUUSD LONG 175 operazioni
📈 Equity curve backtest
2018–2025 · 8 anni
📊 P&L per anno (backtest, rendimento composto)
DD %
−4,49%
R/DD
39,35
PF
4,15
Sharpe
3,62
Win Rate
18,9%
Trades
175
Operativi
0
Ricerca
0
XAUUSD OP M5 ST H1/D1 SL 0.5% · TP 14.1% 🕐 04:00-14:00
#16 Strategia 3.97.190(1)
Test a Mercato MM DIN.
⚙️ Ottimizzazione dinamica
200$ DD1% BE500+T1000$
DD 1% BE $500 TRAIL $1,000
💰 Profitto (con ottimizzazione)
+$267.916
Return: +267,92% su $367.916
GBPJPY Buy & Sell 175 operazioni
📈 Equity curve backtest
2017–2026 · 10 anni
📊 P&L per anno (backtest, rendimento composto)
DD %
−2,20%
R/DD
122,05
PF
8,09
Sharpe
3,85
Win Rate
22,3%
Trades
175
Operativi
1
Ricerca
0
GBPJPY OP M5 ST H1/D1 SL 0.2% · TP 9.1% 🕐 04:00-12:00
#17 Strategia 4.49.168
Test a Mercato MM DIN.
⚙️ Ottimizzazione dinamica
500$ DD1% BE+T1000$
DD 1% BE $500 TRAIL $1,000
💰 Profitto (con ottimizzazione)
+$1.007.432
Return: +1.007,43% su $1.107.432
USDJPY Buy & Sell 507 operazioni
📈 Equity curve backtest
2017–2026 · 10 anni
📊 P&L per anno (backtest, rendimento composto)
DD %
−2,83%
R/DD
355,63
PF
7,04
Sharpe
2,35
Win Rate
34,1%
Trades
507
Operativi
1
Ricerca
0
USDJPY OP M5 ST H1/D1 SL 0.2% · TP 3.5%
#18 Strategia 4.89.106
Test a Mercato MM DIN.
⚙️ Ottimizzazione dinamica
200$ DD1% BE+T1000$
DD 1% BE $1,000 TRAIL $1,000
💰 Profitto (con ottimizzazione)
+$261.589
Return: +261,59% su $361.589
GBPJPY Buy & Sell 174 operazioni
📈 Equity curve backtest
2017–2026 · 10 anni
📊 P&L per anno (backtest, rendimento composto)
DD %
−2,24%
R/DD
116,60
PF
7,19
Sharpe
3,87
Win Rate
21,8%
Trades
174
Operativi
1
Ricerca
0
GBPJPY OP M5 ST H1/D1 SL 0.2% · TP 9.1% 🕐 04:00-12:00
#19 Strategia 4.1.133
Ricerca MM DIN.
⚙️ Ottimizzazione dinamica
200$ DD1% BE+T1000$
DD 1% BE $1,000 TRAIL $1,000
💰 Profitto (con ottimizzazione)
+$617.039
Return: +617,04% su $717.039
GBPJPY Buy & Sell 340 operazioni
📈 Equity curve backtest
2017–2026 · 10 anni
📊 P&L per anno (backtest, rendimento composto)
DD %
−3,46%
R/DD
178,16
PF
8,74
Sharpe
1,88
Win Rate
15,0%
Trades
340
Operativi
0
Ricerca
0
GBPJPY OP M5 ST H1/D1 SL 0.1% · TP 11.3% 24/7
#20 Strategia 3.6.191
Ricerca MM DIN.
⚙️ Ottimizzazione dinamica
500$ DD1%
DD 1%
💰 Profitto (con ottimizzazione)
+$388.805
Return: +388,81% su $488.805
USDJPY Buy & Sell 302 operazioni
📈 Equity curve backtest
2017–2026 · 10 anni
📊 P&L per anno (backtest, rendimento composto)
DD %
−5,36%
R/DD
72,50
PF
2,96
Sharpe
2,43
Win Rate
18,2%
Trades
302
Operativi
0
Ricerca
0
USDJPY OP M5 ST H1/D1 SL 0.2% · TP 3.5% 🕐 04:00-12:00
#21 Strategia 3.41.118
Ricerca MM DIN.
⚙️ Ottimizzazione dinamica
500$ DD1% BE+T1000$
DD 1% BE $1,000 TRAIL $1,000
💰 Profitto (con ottimizzazione)
+$458.384
Return: +458,38% su $558.384
EURJPY Buy & Sell 139 operazioni
📈 Equity curve backtest
2017–2026 · 10 anni
📊 P&L per anno (backtest, rendimento composto)
DD %
−3,34%
R/DD
137,40
PF
9,63
Sharpe
2,99
Win Rate
28,1%
Trades
139
Operativi
0
Ricerca
0
EURJPY OP M5 ST H1/D1 SL 0.2% · TP 15% 🕐 04:00-12:00
#22 Strategia 3.24.135
Test a Mercato MM DIN. ▶ VIDEO
⚙️ Ottimizzazione dinamica
350$ DD0.5%
DD 0.5%
💰 Profitto (con ottimizzazione)
+$285.163
Return: +285,16% su $385.163
XAUUSD Buy & Sell 63 operazioni
📈 Equity curve backtest
2017–2026 · 10 anni
📊 P&L per anno (backtest, rendimento composto)
DD %
−3,52%
R/DD
81,06
PF
12,05
Sharpe
4,02
Win Rate
19,1%
Trades
63
Operativi
0
Ricerca
0
XAUUSD OP M5 ST H1/D1 SL 0.4% · TP 20.7% 🕐 17:00-10:00
#23 Strategia 3.1.164(1)
✨ NEW Ricerca MM DIN.
⚙️ Ottimizzazione dinamica
500$ DD1% BE+T1000$
DD 1% BE $1,000 TRAIL $1,000
💰 Profitto (con ottimizzazione)
+$1.991.332
Return: +1.991,33% su $2.091.332
GBPJPY Buy & Sell 276 operazioni
📈 Equity curve backtest
2017–2026 · 10 anni
📊 P&L per anno (backtest, rendimento composto)
DD %
−3,68%
R/DD
541,58
PF
14,47
Sharpe
2,03
Win Rate
30,1%
Trades
276
Operativi
0
Ricerca
0
GBPJPY OP M5 ST H1/D1 SL 0.1% · TP 11.3% 24/7
#24 Strategia 1.53.159
Ricerca MM DIN.
⚙️ Ottimizzazione dinamica
200$ DD0.5%
DD 0.5%
💰 Profitto (con ottimizzazione)
+$203.349
Return: +203,35% su $303.349
EURUSD Buy & Sell 104 operazioni
📈 Equity curve backtest
2017–2026 · 10 anni
📊 P&L per anno (backtest, rendimento composto)
DD %
−3,41%
R/DD
59,55
PF
6,59
Sharpe
3,05
Win Rate
9,6%
Trades
104
Operativi
0
Ricerca
0
EURUSD OP M5 ST H1/D1 SL 0.1% · TP 7.8% 🕐 04:00-12:00
#25 Strategia 1.41.104
Ricerca MM DIN.
⚙️ Ottimizzazione dinamica
500$ DD1% BE1000$
DD 1% BE $1,000
💰 Profitto (con ottimizzazione)
+$507.706
Return: +507,71% su $607.706
EURUSD Buy & Sell 139 operazioni
📈 Equity curve backtest
2017–2026 · 10 anni
📊 P&L per anno (backtest, rendimento composto)
DD %
−4,42%
R/DD
114,90
PF
8,07
Sharpe
2,94
Win Rate
6,5%
Trades
139
Operativi
0
Ricerca
0
EURUSD OP M5 ST H1/D1 SL 0.1% · TP 7.8% 🕐 04:00-12:00
#26 Strategia 1.16.163
Ricerca MM DIN.
⚙️ Ottimizzazione dinamica
500$ DD1% BE+T1000$
DD 1% BE $1,000 TRAIL $1,000
💰 Profitto (con ottimizzazione)
+$1.666.624
Return: +1.666,62% su $1.766.624
GBPJPY Buy & Sell 368 operazioni
📈 Equity curve backtest
2017–2026 · 10 anni
📊 P&L per anno (backtest, rendimento composto)
DD %
−3,25%
R/DD
512,58
PF
10,54
Sharpe
1,82
Win Rate
25,3%
Trades
368
Operativi
1
Ricerca
0
GBPJPY OP M5 ST H1/D1 SL 0.1% · TP 11.3% 24/7
#27 Strategia 1.1.128
✨ NEW Ricerca MM DIN.
⚙️ Ottimizzazione dinamica
200$ DD1% BE+T1000$
DD 1% BE $1,000 TRAIL $1,000
💰 Profitto (con ottimizzazione)
+$556.508
Return: +556,51% su $656.508
GBPJPY Buy & Sell 350 operazioni
📈 Equity curve backtest
2017–2026 · 10 anni
📊 P&L per anno (backtest, rendimento composto)
DD %
−3,33%
R/DD
167,16
PF
8,13
Sharpe
1,80
Win Rate
14,3%
Trades
350
Operativi
0
Ricerca
0
GBPJPY OP M5 ST H1/D1 SL 0.1% · TP 11.3% 24/7
#28 Strategia 1.54.157 bis
✨ NEW Ricerca MM DIN.
⚙️ Ottimizzazione dinamica
500$ DD1% BE+T1000$
DD 1% BE $1,000 TRAIL $1,000
💰 Profitto (con ottimizzazione)
+$1.991.866
Return: +1.991,87% su $2.091.866
XAUUSD Buy & Sell 236 operazioni
📈 Equity curve backtest
2017–2026 · 10 anni
📊 P&L per anno (backtest, rendimento composto)
DD %
−2,26%
R/DD
882,19
PF
17,75
Sharpe
2,33
Win Rate
37,3%
Trades
236
Operativi
0
Ricerca
0
XAUUSD (BIS) OP M5 ST H1/D1 SL 0.2% · TP 10%
#29 Strategia 2.1.165(1) bis
✨ NEW Ricerca MM DIN.
⚙️ Ottimizzazione dinamica
500$ DD1% BE1000$
DD 1% BE $1,000
💰 Profitto (con ottimizzazione)
+$1.331.783
Return: +1.331,78% su $1.431.783
GBPJPY Buy & Sell 220 operazioni
📈 Equity curve backtest
2017–2026 · 10 anni
📊 P&L per anno (backtest, rendimento composto)
DD %
−6,58%
R/DD
202,36
PF
12,55
Sharpe
2,05
Win Rate
6,4%
Trades
220
Operativi
0
Ricerca
0
GBPJPY OP M5 ST H1/D1 SL 0.1% · TP 11.3% 24/7
#30 Strategia 2.1.165(1)
✨ NEW Ricerca MM DIN.
⚙️ Ottimizzazione dinamica
500$ DD1% BE+T1000$
DD 1% BE $1,000 TRAIL $1,000
💰 Profitto (con ottimizzazione)
+$2.024.736
Return: +2.024,74% su $2.124.736
GBPJPY Buy & Sell 274 operazioni
📈 Equity curve backtest
2017–2026 · 10 anni
📊 P&L per anno (backtest, rendimento composto)
DD %
−3,68%
R/DD
550,65
PF
14,87
Sharpe
2,05
Win Rate
30,7%
Trades
274
Operativi
0
Ricerca
0
GBPJPY OP M5 ST H1/D1 SL 0.1% · TP 11.3% 24/7
#31 Strategia 3.29.192
Ricerca MM DIN.
⚙️ Ottimizzazione dinamica
500$ DD1%
DD 1%
💰 Profitto (con ottimizzazione)
+$404.653
Return: +404,65% su $504.653
XAUUSD Buy & Sell 95 operazioni
📈 Equity curve backtest
2017–2026 · 10 anni
📊 P&L per anno (backtest, rendimento composto)
DD %
−6,80%
R/DD
59,47
PF
7,92
Sharpe
3,66
Win Rate
12,6%
Trades
95
Operativi
0
Ricerca
0
XAUUSD OP M5 ST H1/D1 SL 0.4% · TP 21.9% 🕐 17:00-10:00
#32 Strategia 3.3.164
✨ NEW Ricerca MM DIN.
⚙️ Ottimizzazione dinamica
500$ DD1% BE+T1000$
DD 1% BE $1,000 TRAIL $1,000
💰 Profitto (con ottimizzazione)
+$528.816
Return: +528,82% su $628.816
GBPUSD Buy & Sell 104 operazioni
📈 Equity curve backtest
2017–2026 · 10 anni
📊 P&L per anno (backtest, rendimento composto)
DD %
−5,32%
R/DD
99,48
PF
9,05
Sharpe
2,56
Win Rate
21,2%
Trades
104
Operativi
0
Ricerca
0
GBPUSD OP M5 ST H1/D1 SL 0.1% · TP 17.7% 24/7
#33 Strategia 3.56.131
Ricerca MM DIN.
⚙️ Ottimizzazione dinamica
200$ DD1%
DD 1%
💰 Profitto (con ottimizzazione)
+$148.800
Return: +148,80% su $248.800
XAUUSD Buy & Sell 165 operazioni
📈 Equity curve backtest
2017–2026 · 10 anni
📊 P&L per anno (backtest, rendimento composto)
DD %
−4,91%
R/DD
30,31
PF
5,04
Sharpe
3,39
Win Rate
14,6%
Trades
165
Operativi
0
Ricerca
0
XAUUSD OP M5 ST H1/D1 SL 0.4% · TP 18.6% 🕐 17:00-10:00
#34 Strategia 4.16.168
Ricerca MM DIN.
⚙️ Ottimizzazione dinamica
500$ DD1% BE+T1000$
DD 1% BE $1,000 TRAIL $1,000
💰 Profitto (con ottimizzazione)
+$653.277
Return: +653,28% su $753.277
GBPJPY Buy & Sell 172 operazioni
📈 Equity curve backtest
2017–2026 · 10 anni
📊 P&L per anno (backtest, rendimento composto)
DD %
−5,96%
R/DD
109,67
PF
8,11
Sharpe
2,84
Win Rate
19,2%
Trades
172
Operativi
0
Ricerca
0
GBPJPY OP M5 ST H1/D1 SL 0.1% · TP 9.6% 24/7
#35 Strategia 4.56.136
Test a Mercato MM DIN.
⚙️ Ottimizzazione dinamica
200$ DD0.5%
DD 0.5%
💰 Profitto (con ottimizzazione)
+$162.897
Return: +162,90% su $262.897
XAUUSD Buy & Sell 92 operazioni
📈 Equity curve backtest
2017–2026 · 10 anni
📊 P&L per anno (backtest, rendimento composto)
DD %
−3,57%
R/DD
45,59
PF
8,29
Sharpe
3,66
Win Rate
13,0%
Trades
92
Operativi
1
Ricerca
0
XAUUSD OP M5 ST H1/D1 SL 0.4% · TP 15% 🕐 17:00-10:00
#36 Strategia 4.76.132
Ricerca MM DIN.
⚙️ Ottimizzazione dinamica
200$ DD0.5%
DD 0.5%
💰 Profitto (con ottimizzazione)
+$357.211
Return: +357,21% su $457.211
GBPUSD Buy & Sell 129 operazioni
📈 Equity curve backtest
2017–2026 · 10 anni
📊 P&L per anno (backtest, rendimento composto)
DD %
−3,93%
R/DD
90,89
PF
7,47
Sharpe
2,28
Win Rate
9,3%
Trades
129
Operativi
0
Ricerca
0
GBPUSD OP M5 ST H1/D1 SL 0.1% · TP 8.6% 🕐 04:00-12:00
Aggiornato: 24 Mag 2026 12:10

To develop our business we work with

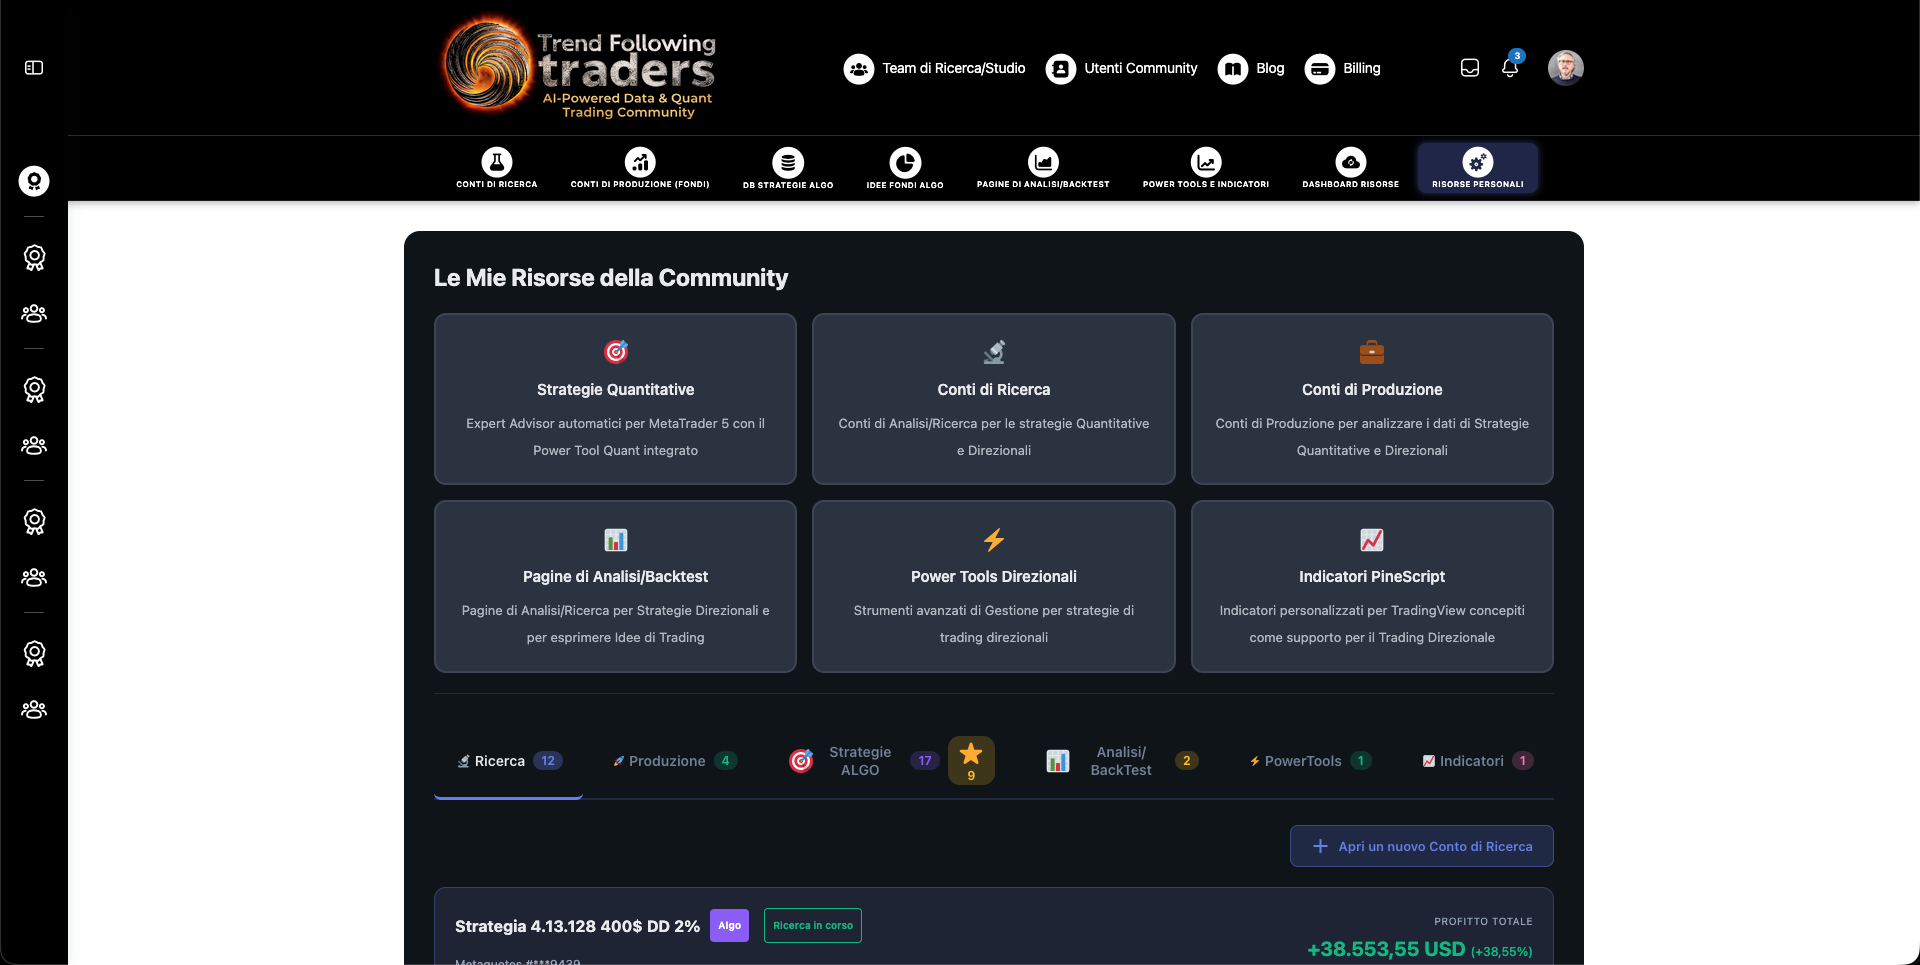
Join the Community to train and collaborate

The Business Community offers a structured training path lasting 6 and 12 months, with mandatory tests. The goal is to train and select members to ensure that work teams include people who are genuinely oriented toward business development. The training program faithfully retraces the learning path developed over time, from the basics to the most advanced topics.

One of the main functions of the training path is to allow all members to share the same operational and conceptual language. Starting from the same foundations, studying the same methods and adopting the same references is the necessary condition for collaborating effectively in work teams. Stefano Mastria’s trading — his methodologies, his tools and his research process — represents the common foundation from which to start developing innovative strategies together and continuously improving the community’s operations.

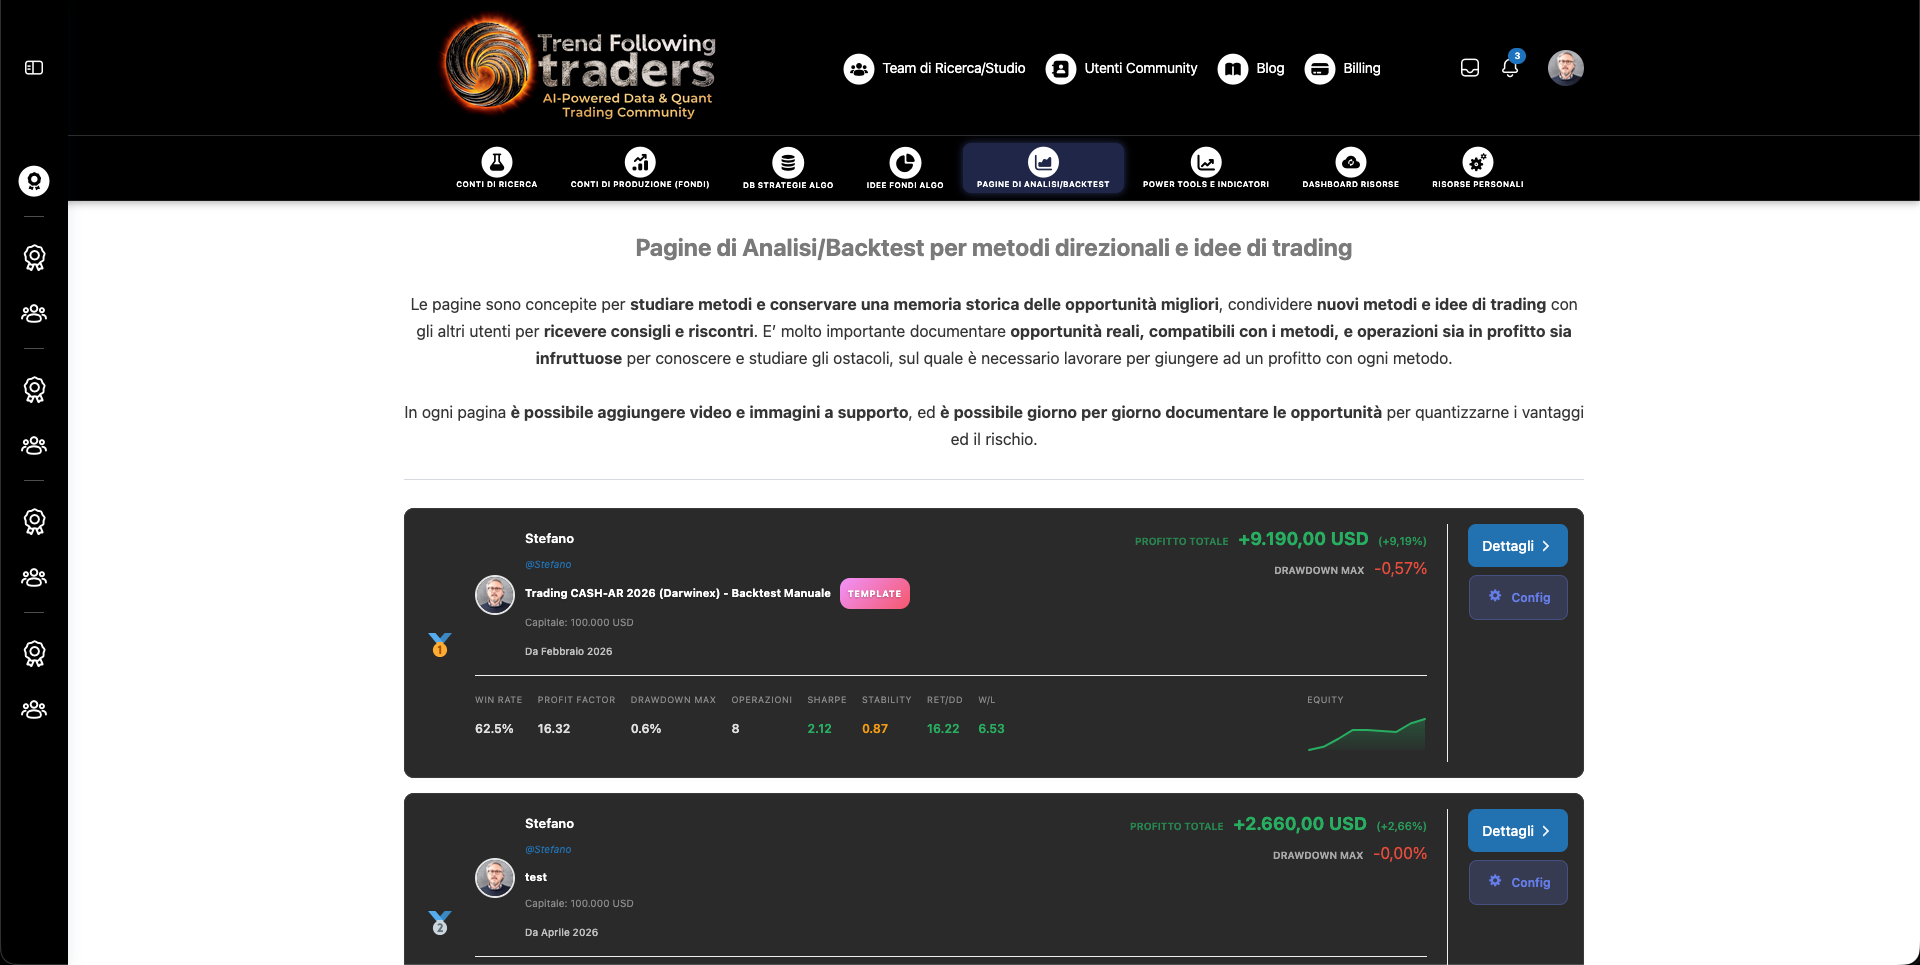
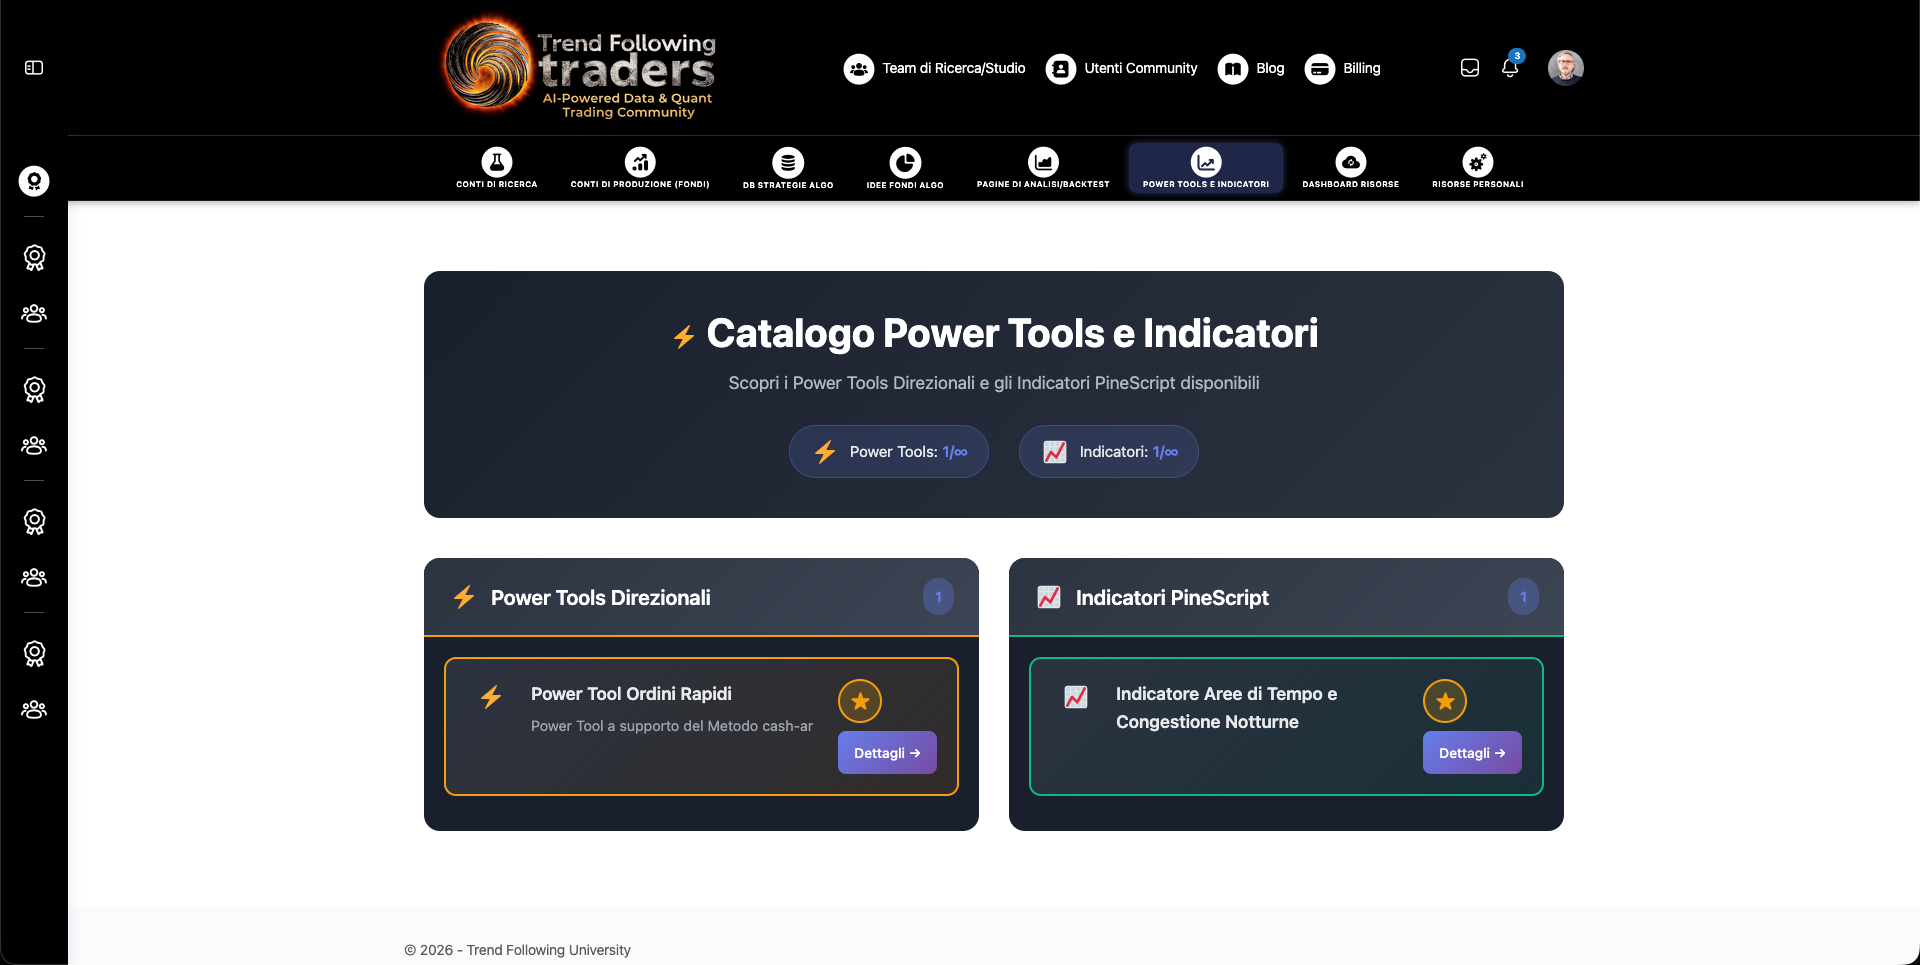
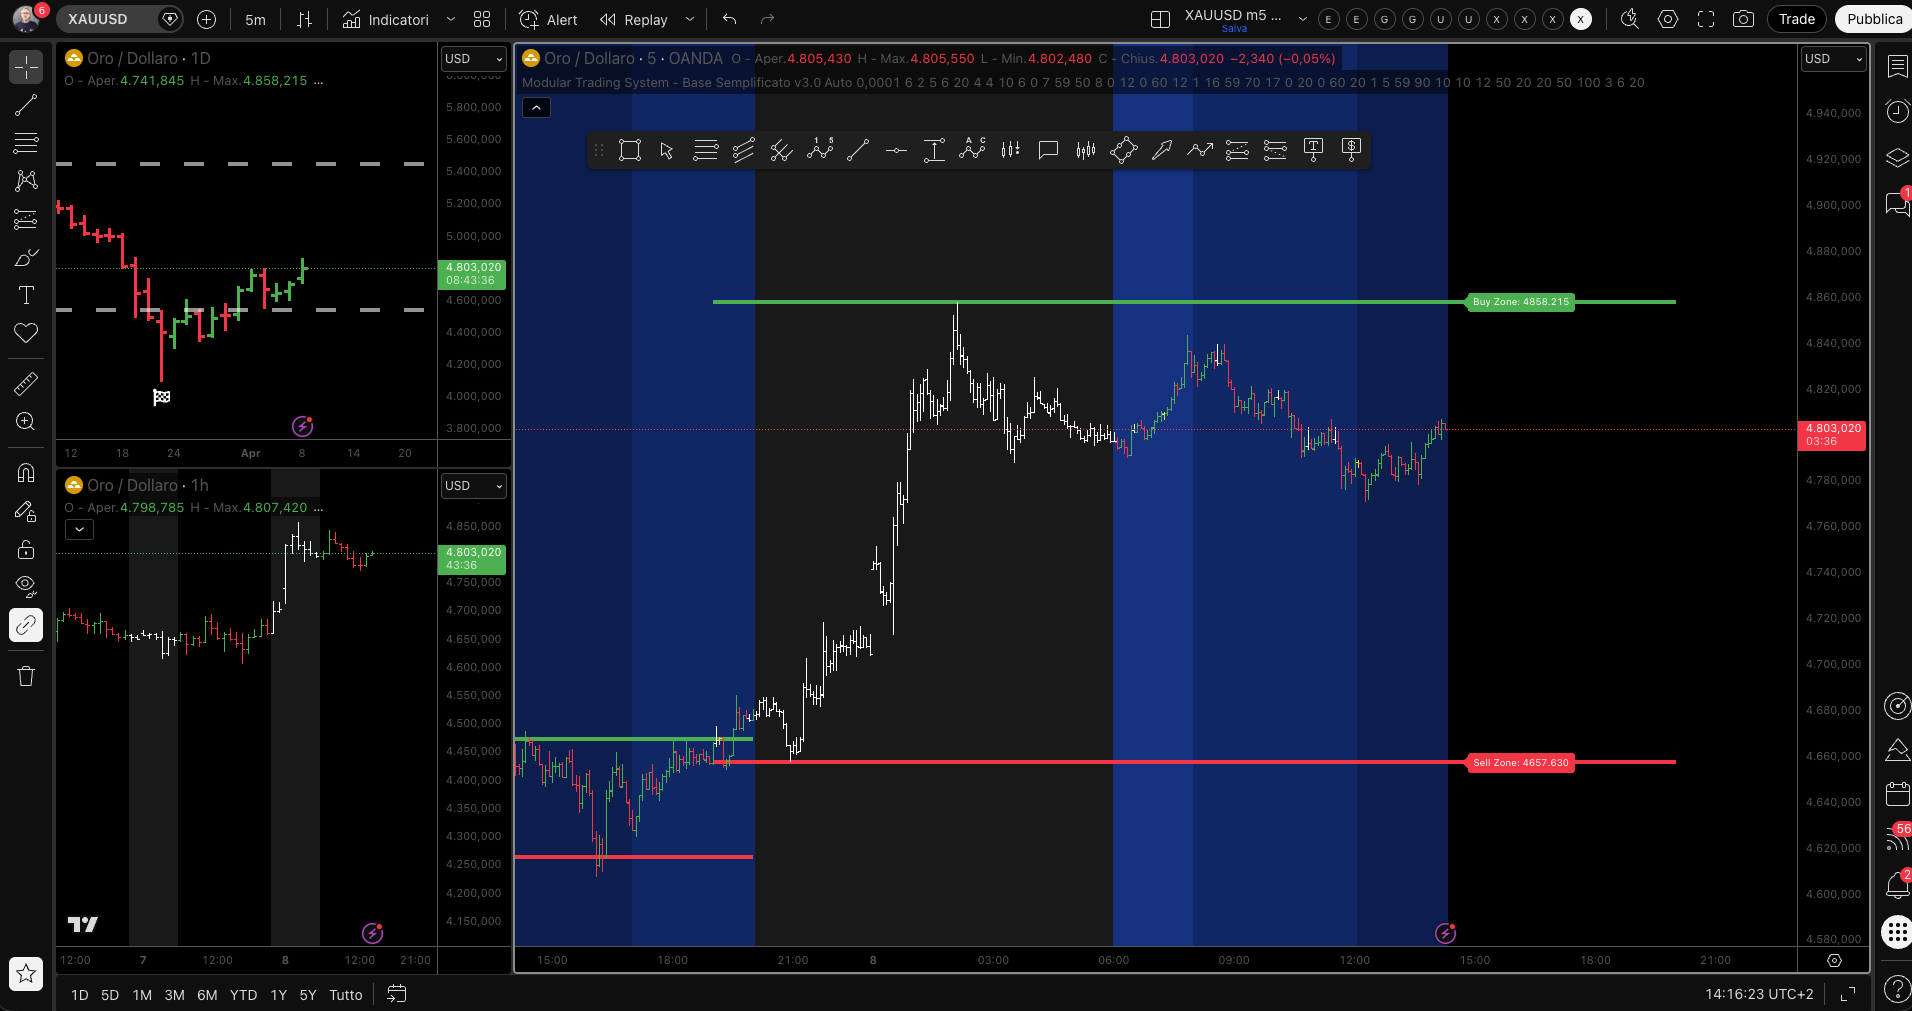
Alongside the training path, members participate in live sessions within work teams to operate on the markets, deepen their knowledge of the Cash-AR 2026 Method and contribute to research activities on both directional and automated trading. In the Community University, the schedule of additional activities is periodically published: thematic live sessions, TradingWeek and specific training events.

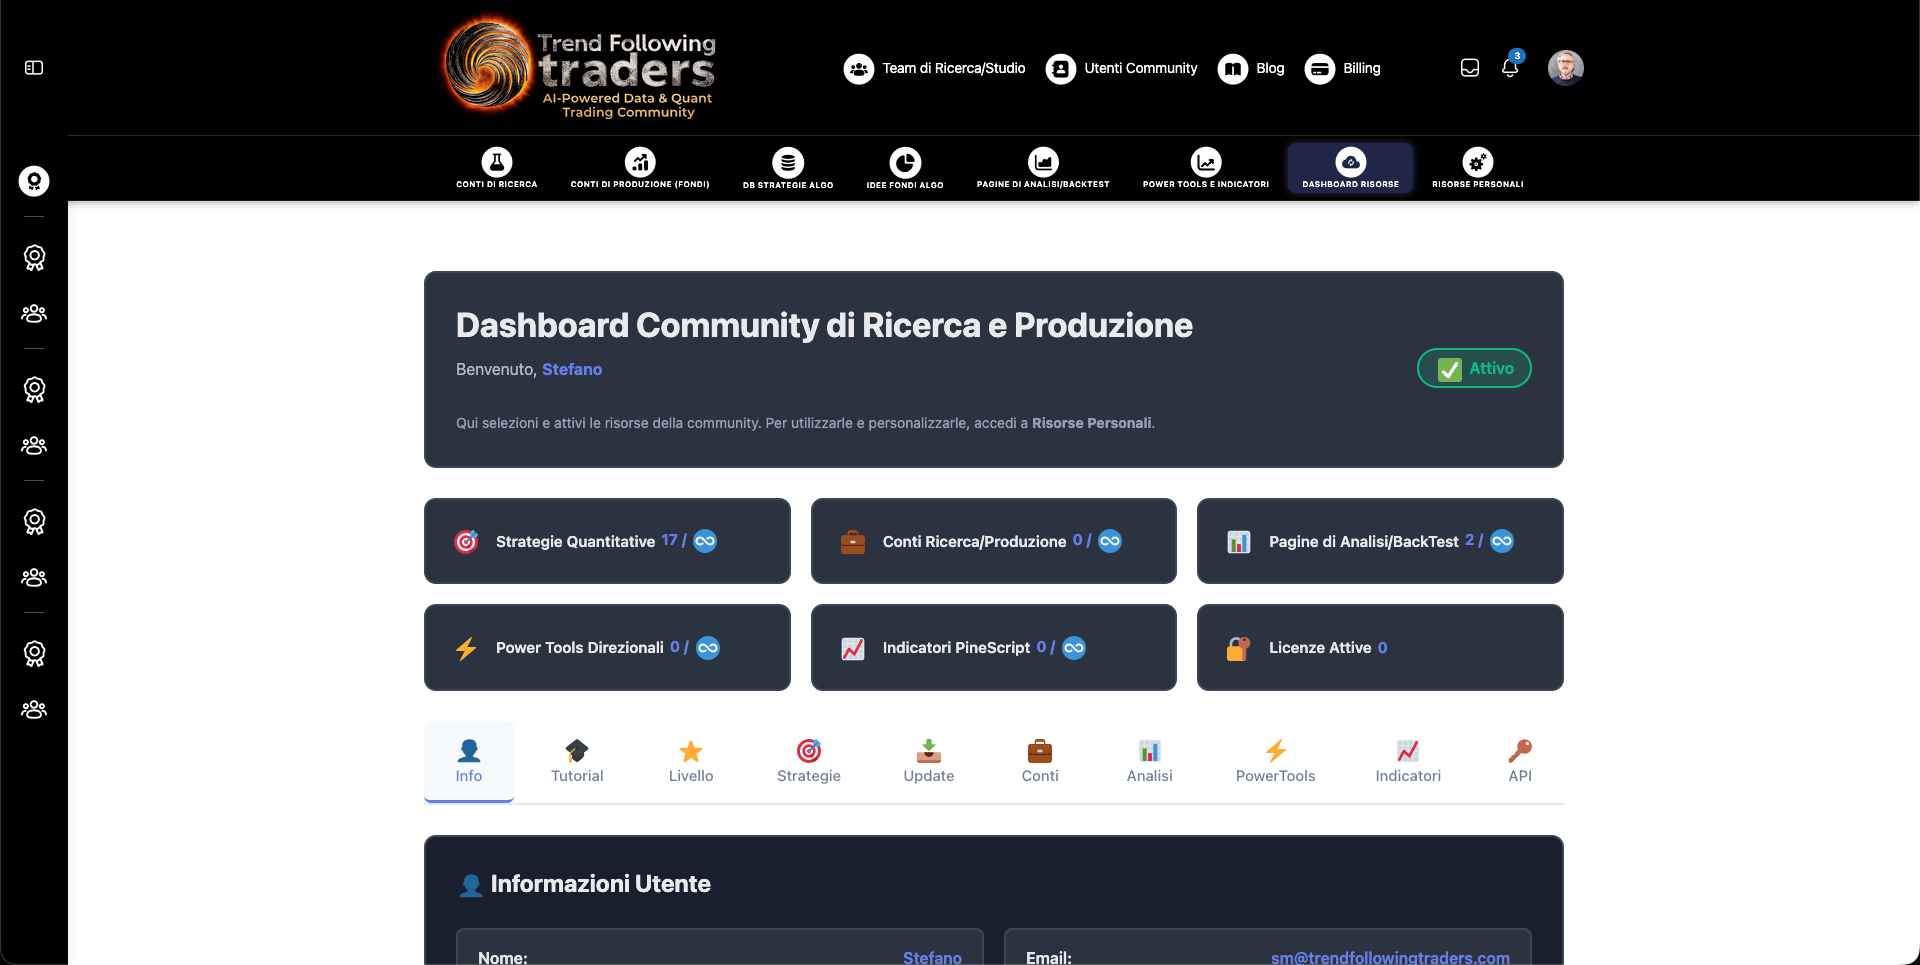
Each member’s progress is measured through a Training Credits system, awarded by completing mandatory tests and participating in work team activities. To obtain the Community Trader qualification, it is necessary to complete all tests, practical activities and 12 months of real trading, for a total of 5,000 training credits.

The cost of access to the community is 45 euros per month or 450 euros per year, with no additional costs. Passing the tests is a necessary requirement to access subsequent modules. Within the Community University, it is possible to contact Stefano Mastria directly for individual support, or to post questions and ideas for discussion with other members.

To register Click Here.
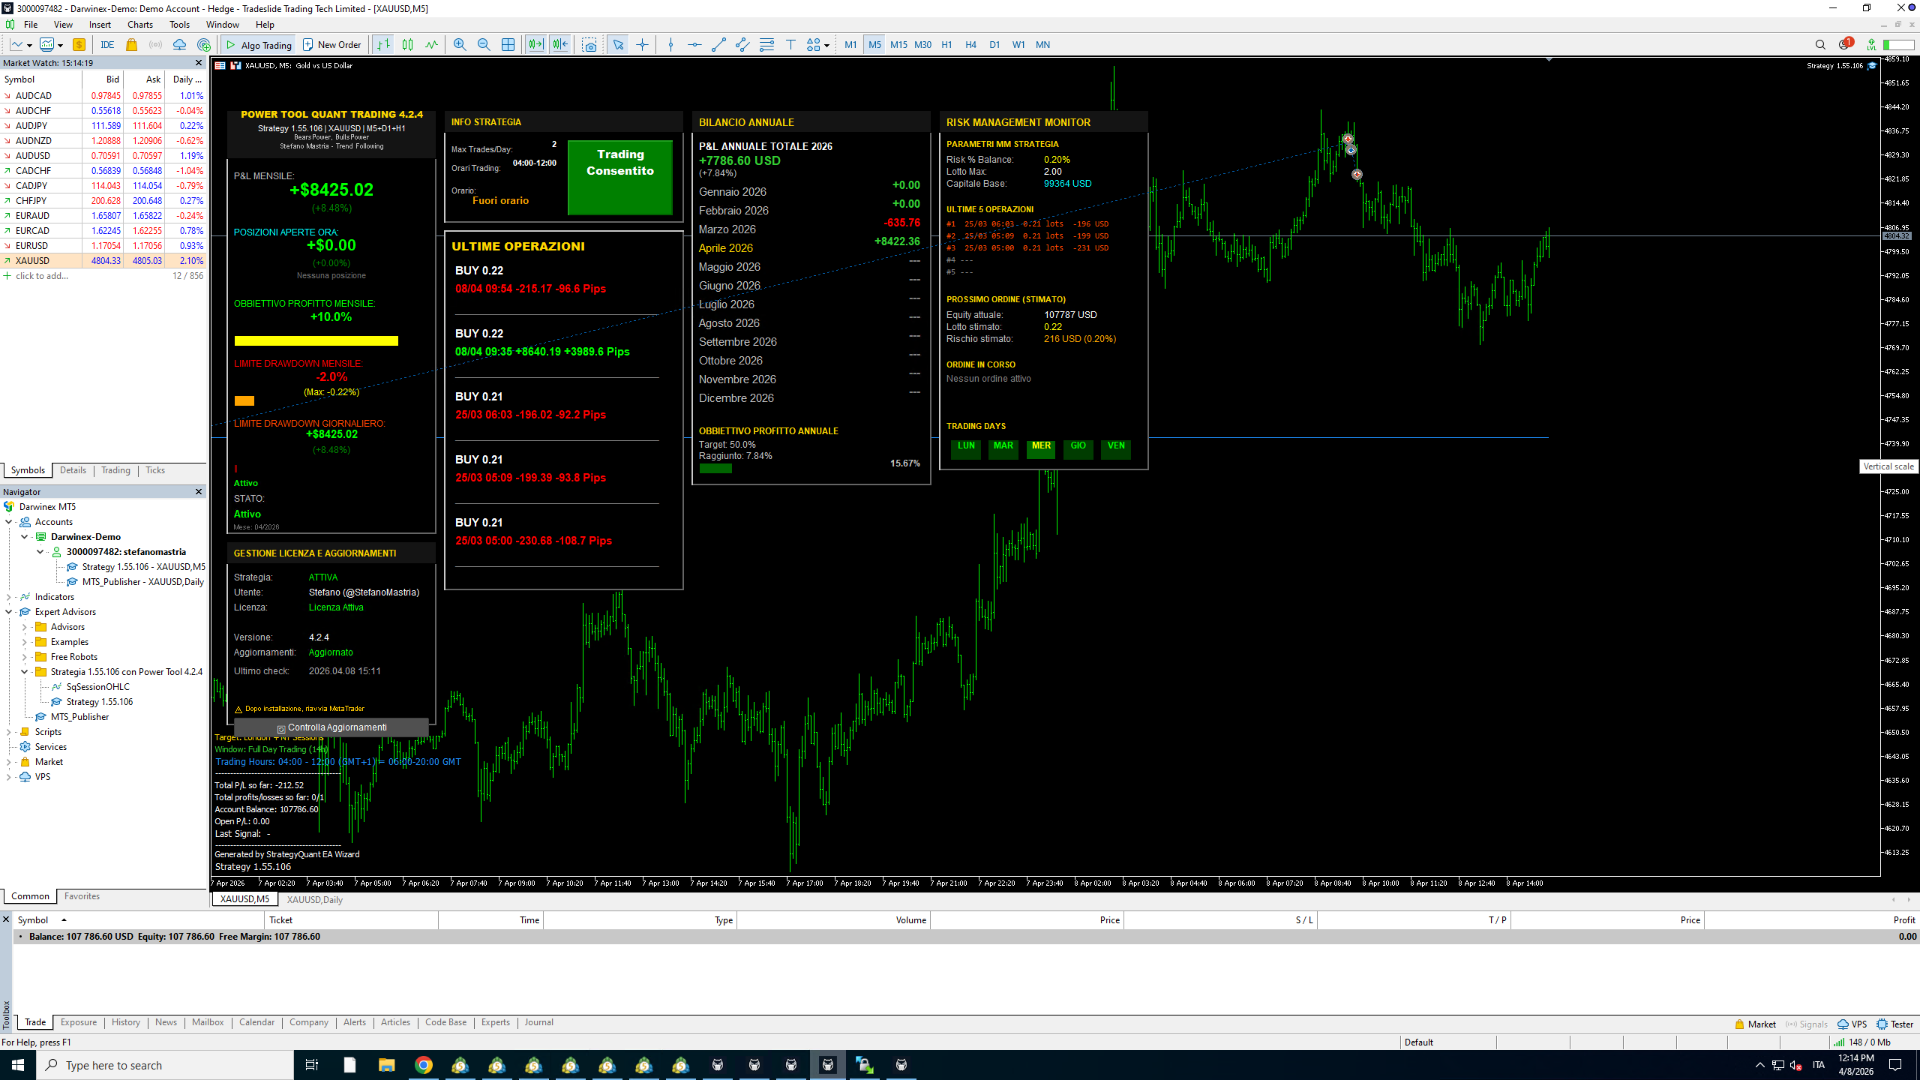
The Community and Resources for Members

Trend Following Traders was founded in 2014 as an open research laboratory, not as a collection of pre-packaged courses. The tools available on the platform are those concretely used every day to develop, test and deploy directional and quantitative trading strategies.

All the resources available in the community have been developed and continuously improved using Claude Code artificial intelligence: from the data analysis platform to the quantitative strategies database, from Power Tools in MQL5 to PineScript indicators for TradingView, through to the monitoring systems for research and production accounts. Tools built in-house, designed to meet the real needs of daily trading.

The educational path is based on the principles of Trend Following and on the research work developed over time, with a practical and realistic approach documented on a daily basis. A necessary starting point for every user in order to “speak the same language”.

DB Quantitative Strategies

The central database collects all the algorithmic strategies developed and validated by the research team. For each strategy, verified backtests, complete statistics — Profit Factor, Drawdown, Win Rate, Sharpe Ratio — historical equity curves and a badge system indicating market, timeframe, operating hours, direction and risk parameters are available. The Strategies are developed with StrategyQuantX leveraging the strong computing power provided by Amazon AWS EC2. The system for calculating and validating MQL5 strategies is very strict, on a par with a Hedge Fund. Furthermore, each quantitative strategy, after being calculated and selected, is subjected to an integration process to add our Power Tool 4.2.4 developed with Claude CODE AI to monitor the balance and vital functions of the strategy.

Research Accounts

Research accounts are dedicated to testing new strategies before moving to production. Synchronized in real time with MetaTrader 5, they display complete statistics, open positions, interactive equity curves and detailed trade history. This is the space where variants, optimizations and new ideas are tested — with virtual or reduced capital and full transparency throughout the process.

Production Accounts and Private Funds

Real trading is organized into multi-strategy Funds, a structure that allows managing diversified portfolios across multiple brokers, separating strategies with different risk profiles and maintaining an aggregated view of performance. Each fund has a configurable risk profile — Conservative, Moderate, Aggressive — and a defined time horizon. All results are verifiable and automatically updated directly from the Metatrader 5 platforms.

Analysis/Backtest Pages

The analysis pages allow you to document and share trading research, both directional and quantitative. You can upload backtests in SQX format, or manually upload data trade by trade, to analyze them with interactive charts and apply the dynamic optimization function — exclusive to the platform — to simulate in real time the effect of variations in lots, drawdown limit, and hourly and daily filters.

Directional Power Tools

Power Tools are Expert Advisors developed with Claude CODE AI for directional trading on MetaTrader 5. They include advanced position management, dynamic trailing stops and risk management automation. Configurations can be saved, the interface operates directly on the chart and each tool comes with documentation and video tutorials.

PineScript Indicators

A collection of indicators specifically developed for Trend Following methodologies, not publicly available. Code developed and optimized with Claude CODE AI, integrated with community strategies and updated over time. Once access is granted, the indicators are added directly to the TradingView account.

Resources Dashboard

Every member has access to a Resources Dashboard from which it is possible to activate and manage all the resources made available by the community: Automatic Quantitative Strategies, Research Accounts, Production Accounts, Analysis and Backtest Pages for the study and testing of directional methods, Power Tools in MQL5 and PineScript Indicators for TradingView.

Personal Resources

The Personal Resources section gathers in one single space everything that each member has activated and configured within the platform. From here it is possible to study the assigned quantitative strategies, monitor the status of research and production accounts, consult the analysis and backtest pages, manage Power Tools and PineScript indicators. A complete and always up-to-date overview of one’s journey within the community.

Quantitative MQL5 Strategies with Power Tool 4.2 with Automatic Updates

The quantitative strategies available in the community are developed with StrategyQuantX, leveraging the computing power of the EC2 Amazon AWS infrastructure. The result is a rigorous and systematic research process, comparable in method and standards to that adopted by professional hedge funds.

Every strategy comes with Power Tool 4.2, a software developed internally with Claude Code artificial intelligence, designed to monitor the balance, supervise operational processes and automatically distribute updates. This mechanism allows strategies to adapt over time and remain competitive in the market with minimal manual intervention.

Latest updates

Consult the latest videos and articles to learn about trend following and the activities of our community.
Claude Code e trading quantitativo: le tre funzioni che hanno cambiato il mio lavoro di ricerca

Claude Code e trading quantitativo: le 3 funzioni che hanno cambiato il mio lavoro di ricerca

Tutto quello che sto per raccontare in questo articolo, l’ho pianificato oltre dieci anni fa. Avevo le idee chiare, sapevo...
Leggi tutto l’articolo
Tool Proprietario Analisi Trading Quantitativo con Claude Code

Tool Proprietario Analisi Trading Quantitativo con Claude Code

Oggi ti voglio mostrare qualcosa su cui lavoro da oltre dieci anni. Un progetto che ho sempre avuto in mente,...
Leggi tutto l’articolo

Inizia con questi Tutorial per capire come funziona il Trend Following Start with these Tutorials to understand how Trend Following works

Basic topics to understand how the business works. Watch these videos first, to get a clear idea of how every trader in the Community works, to produce results with Trend Following and Day Trading Strategies.

[mailpoet_form id=”2″]

GDPR