
Trend Following Position Sizing: ATR vs Fixed Risk
Some links on this page are affiliate links: if you sign up through them, we may earn a commission at no extra cost to you.
Trend following position sizing is the decision of how much to put at risk on each trade, and in a method where most attempts end in a small loss it matters at least as much as the entry signal. There are two common ways to answer it: risk a fixed fraction of the account on every trade and let the stop distance decide the size, or measure each market’s volatility (the ATR, or “N” in the Turtle vocabulary) and size every position so that a normal swing costs roughly the same amount everywhere. This article compares the two with a worked arithmetic example, clearly labelled as illustrative.
It is educational material, not advice: no sizing rule can turn a bad strategy into a good one, and neither backtests nor past results guarantee anything about the future.
What is position sizing in trend following?
Position sizing answers one question: given the risk I accept on this trade, how many units (shares, contracts, lots) should I open? The standard formula is simple: units = money at risk ÷ risk per unit, where the risk per unit is the distance between entry and stop, expressed in money. If you accept losing $500 and your stop is $4 away from entry, you buy 125 units.
Trend following makes this choice especially important because of how the method pays. As we explain in our article on risk reward in trend following, you accept several small, controlled losses in order to be present when a strong trend produces a large profit. Our founder, Stefano Mastria, describes this as spending little on each attempt. That only works if “little” is genuinely small and stays small: a few oversized positions can use up in a week the capital that many small losses were supposed to protect.
In his money management teaching, which Stefano has written about in Italian, Van Tharp describes position sizing as the operational core of money management: define the maximum risk per event before the trade, and you limit losses and keep control of capital through a losing streak. He also expresses results as R-multiples, the trade result divided by the initial risk (1R): risk $100 and make $250 and you have made +2.5R; a stopped-out trade is −1R. Both ideas are the foundation for what follows.
How does fixed fractional risk per trade work?
The fixed fractional approach sets the money at risk as a constant percentage of current equity, for example 1%. The size then follows from where the stop sits: wider stop, fewer units; tighter stop, more units. With a $50,000 account and 1% risk, every trade can lose about $500 if the stop is hit, whatever the market.
Two properties make it popular. First, it is easy to apply and to explain. Second, because it is a percentage of equity, positions shrink after losses and grow after gains, so the loss from a bad run is a share of what is left, not a fixed amount. Many traders also like that it speaks the same language as R-multiples: every trade starts with about the same 1R.
The weakness is not in the percentage but in how the stop is chosen. If the stop is set at an arbitrary fixed distance (say 5% below entry) in every market, the same rule means very different things in a calm market and in a wild one. In the wild one, the stop may sit inside the market’s ordinary daily noise and get hit by random movement, not because the trend ended.
What is volatility-based position sizing with ATR?
Volatility-based sizing keeps the fixed-risk idea but lets the market set the stop distance. The tool is the Average True Range (ATR), a measure of how far a market typically moves in a period, including gaps. You place the stop a multiple of the ATR away from entry (for example 2 ATR) and size the position from that distance.
The best-known historical version comes from the Turtle Traders, the group trained by Richard Dennis and William Eckhardt in the early 1980s. According to an MQL5 reconstruction of the original Turtle rules, which draws on the rules Curtis Faith published in Way of the Turtle in 2003, the Turtles measured volatility with a quantity called N, defined as a 20-day exponential average of the True Range with Wilder’s smoothing. A position “unit” was then sized so that the account risk per unit was about 1% of equity, with the stop placed at 2N. We found these numbers in that one source, so treat them as a third-party reconstruction to be checked against the book, not as a spec. The principle, though, is clear: the position size is inversely proportional to the market’s volatility.
The consequence is that each market contributes a comparable amount of risk. A quiet market gets a larger position, a turbulent one a smaller position, and a single sizing rule can be applied to a diversified portfolio. Notice that this is not an alternative to fixed fractional risk: it is fixed fractional risk with the stop distance supplied by the market’s volatility.
Fixed fractional vs ATR sizing: a worked example
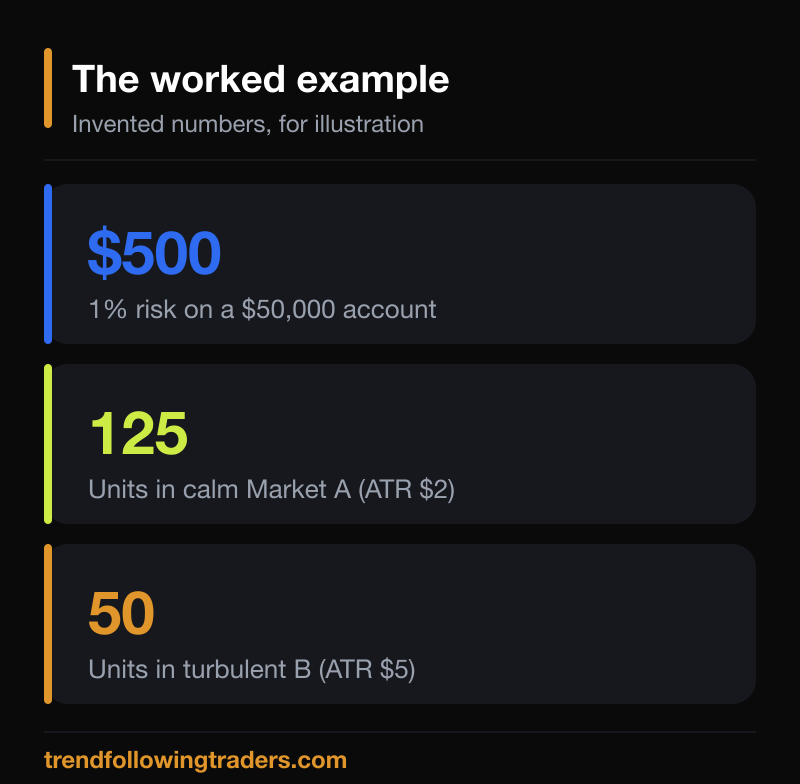
 The numbers below are invented for illustration. They are not a recommendation, not a real trade and not a result. Take a $50,000 account, risking 1% ($500) per trade, and two markets that each trade at $100 per unit (and, for simplicity, $1 of profit or loss per unit per $1 move):
- Market A is calm: ATR = $2.
- Market B is turbulent: ATR = $5.
Method 1: fixed fractional with a fixed 5% stop
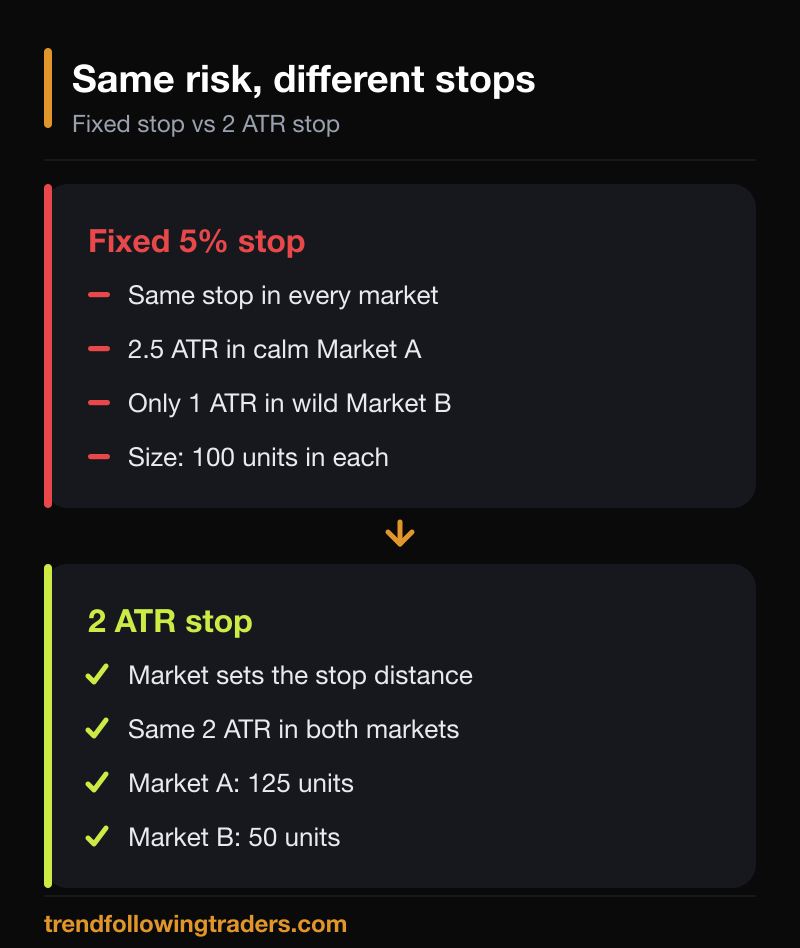
The stop is $5 below entry in both markets. Size = $500 ÷ $5 = 100 units in each, for a notional of $10,000 per market. On paper the risk is identical, but look at what the stop means: in Market A $5 is 2.5 ATR, a stop with room to breathe; in Market B it is exactly 1 ATR, a distance the market covers on an ordinary day. The same rule gives a comfortable stop in one market and a very fragile one in the other.
Method 2: fixed fractional with a 2 ATR stop
Market A: stop distance = 2 × $2 = $4, size = $500 ÷ $4 = 125 units (notional $12,500). Market B: stop distance = 2 × $5 = $10, size = $500 ÷ $10 = 50 units (notional $5,000). The loss if stopped out is $500 in both, but now the stop distance is the same 2 ATR in both markets, so each stop has the same relationship with its market’s noise. The position is bigger where the market is quiet and smaller where it is wild.
What the example shows, and what it does not
 It shows that the two methods are not rivals: ATR sizing is a way to choose the stop distance in a fixed-risk framework. It also shows a trade-off. A 2 ATR stop on a volatile market means a larger distance to the stop, so a smaller position and therefore a smaller profit if the trend runs. What you buy with it is fewer stops triggered by noise. It does not show which approach earns more: that depends on the strategy, the markets, the period and the costs, and only careful testing on data can say anything, with the usual caveat that the past guarantees nothing.
Which trend following position sizing method should you choose?
There is no universal answer, but a few considerations help.
- One market or many. With a single, well-known market and a stop based on its structure, plain fixed fractional risk is often enough. With many markets, volatility-based sizing keeps any one market from dominating the risk.
- Stop logic. If your exit is defined by volatility (a trailing stop at a multiple of the ATR, for instance), sizing by the same ATR keeps the system coherent. If the stop comes from chart structure, size from the actual distance.
- Percentage of risk. The percentage is the real lever on drawdown. Because trend following typically goes through runs of small losses, a percentage that feels harmless on one trade can feel very different after a long sequence. Choose it from the worst losing streak you can tolerate, not from the best case.
- Correlation. Ten positions in ten correlated markets are closer to one big position. Neither sizing method fixes this on its own; it needs a cap on total risk.
In the community’s own research, which uses automated strategies built with StrategyQuant and optimised with AI and tested on about 9.5 years of Darwinex data, risk is treated as something to be set and supervised across many accounts, in the same spirit as a money manager. We do not publish a universal sizing rule, and nothing here describes a result you should expect. For how the two sides of the project fit together, see our overview of directional and automated trading.
How can you test your position sizing before using real money?
Sizing is easy to get right on paper and hard to feel in practice, so test it. Replay history with your entry and exit rules, apply each sizing method to the same trades, and compare the equity curve, the largest drawdown and the longest losing streak, not just the final profit. A backtesting tool for replaying past price data, such as Forex Tester, can be used to compare sizing rules on historical data.
Keep in mind the limits. A backtest is a description of the past; it ignores part of the real cost of trading (spread changes, slippage, gaps), and a rule tuned to fit history can fail the moment conditions change. Use the test to see how a sizing rule behaves under stress and to check that you can live with its worst stretch, not to predict returns.
Frequently asked questions
What is the best position sizing method for trend following?
There is no single best method. Fixed fractional risk and volatility-based (ATR) sizing are usually combined: you risk a fixed percentage of equity and let the ATR set the stop distance. Which percentage and which ATR multiple suit you depends on the strategy, the markets and how much drawdown you can accept.
What is ATR position sizing?
It is sizing a position from the Average True Range: you set the stop at a multiple of the ATR from entry and divide the money you are willing to lose by that distance. Volatile markets get smaller positions, quiet markets larger ones.
What risk per trade is used in trend following?
It varies. Historical accounts of the Turtle rules cite about 1% of equity per unit, but this comes from third-party reconstructions, and it is not a recommendation. Your own figure should come from testing and from the losing streak you can bear.
Does good position sizing guarantee profits?
No. Sizing controls how much a given loss costs and how fast a drawdown can grow; it does not create an edge. A strategy without an edge loses money however carefully it is sized.
This article is for educational purposes only and is not financial advice. Trading involves a real risk of losing capital, and past or simulated results do not guarantee future performance.