
Trend Following vs Mean Reversion: Win Rate and Sideways Cost
Trend following vs mean reversion is, at bottom, a choice between two bets about what a price does next: that it keeps going, or that it comes back. The two approaches look like opposites, and in one respect they are mirror images: one tends to win often with small gains, the other tends to lose often with small losses. This article compares them through the lens that matters most in practice, the win-rate profile and the cost of sideways markets, using the risk-first method we follow in the Trend Following Traders community: small stops, profits left to run, no forecasts. It is educational, not investment advice, and nothing here promises a gain.
What is the difference between trend following and mean reversion?
Trend following buys what is rising and sells what is falling, expecting the move to continue. As the Wikipedia entry on trend following puts it, the trader does not forecast price levels: he or she enters once a trend is established and rides it until it reverses, with position sizing and risk control at the centre of the approach.
Mean reversion starts from the opposite assumption. According to the Wikipedia entry on mean reversion, it is the assumption that an asset’s price will tend to converge to its average over time. The trader measures an average, buys when price is well below it and sells when price is well above it. The same source lists the risks: reversion can take years, and new information can permanently change what the “average” should be.
So the question is not which idea is true. Both behaviours exist in real markets, at different times and on different horizons. The question is what each approach costs you while it is wrong, and how you survive that.
How do the win-rate profiles of the two styles compare?
The core of the comparison is the shape of the results, not the label. A trend following system typically has a low win rate: fewer than half the trades win, and the profit comes from a few large moves that pay for many small, controlled losses. That is the profile we describe in our article on short and long term trend following, and Wikipedia says the same in general terms: a majority of the trades may be unprofitable, yet the strategy can still profit by cutting losses and letting profits run.
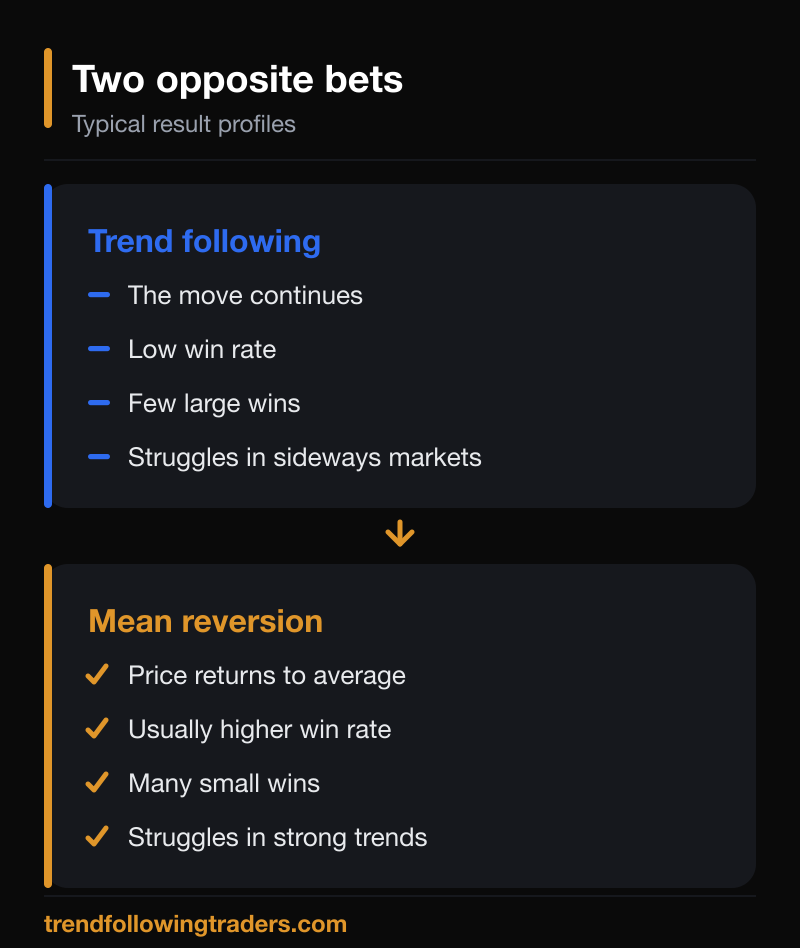 Mean reversion usually looks the other way round. Because it sells strength and buys weakness, it tends to be right often, with each win limited by the distance back to the average. The weakness is the other tail: when the market does not come back, a trade that was “just a bit stretched” keeps stretching, and a single loss can erase many small wins.
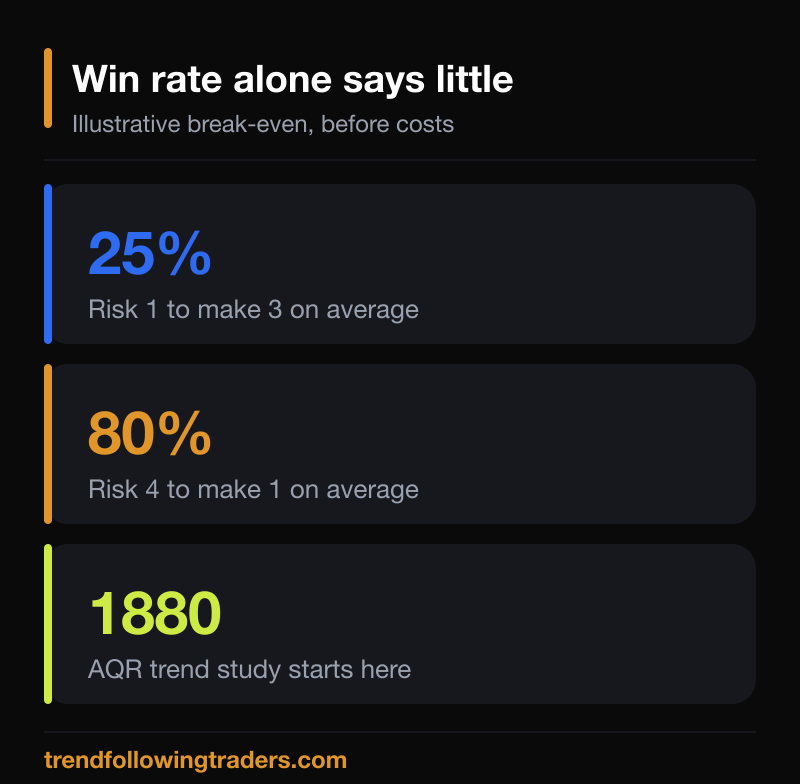
A simple, hypothetical piece of arithmetic shows why the win rate alone tells you nothing. The break-even win rate is the risk divided by the sum of risk and average reward:
- A trend-style trade risking 1 unit to make 3 on average breaks even at a win rate of 25% (1 / (1 + 3)), before costs.
- A reversion-style trade risking 4 units to make 1 on average needs a win rate of 80% (4 / (4 + 1)), before costs.
These numbers are illustrative, not results of any strategy. The point is that “wins 80% of the time” and “wins 30% of the time” can both describe a profitable or a losing system. What matters is the win rate together with the size of wins and losses, and above all what happens in the worst case.
Trend following vs mean reversion: a side-by-side table
| Feature | Trend following | Mean reversion |
|---|---|---|
| Core bet | The move continues | The price returns to its average |
| Typical win rate | Low (fewer than half of trades win) | Usually higher |
| Typical win size vs loss size | Few large wins, many small losses | Many small wins, occasional large losses |
| Where it struggles | Sideways, choppy markets | Strong, persistent trends |
| The cost you feel | A string of small stops | A trade that keeps moving against you |
| What protects you | A small, known stop on every attempt | A hard stop and strict position size, since the loss tail is the danger |
| Psychological test | Patience through many small losses | Discipline not to hold or add to a loser |
The table is a simplification: real strategies mix features, and a mean reversion system with tight stops will look different from one without. It is a map of tendencies, not of guarantees.
What does a sideways market cost each approach?
 This is where the two styles part ways most visibly. A sideways, choppy market is the hardest environment for trend following: the entry is triggered, the move fades, the stop is hit, and it happens again. The cost is real, but it is also known in advance, because each attempt carries a small stop that is decided before the trade. In our method the daily job is exactly this: manage risk precisely and quickly, event after event, and accept small costs as the price of staying in the game.
A range is the natural habitat of mean reversion, so in sideways phases it tends to look better. The test comes when the range breaks. A reversion trader who keeps buying a falling market “because it is cheap” is exposed to a trend moving against every one of those entries. The loss is rarely small unless a stop and a size limit were set from the start.
Our founder Stefano Mastria describes a counter-intuitive observation from the data in the community: the months that produce the biggest profits are often the months that cost little, and when the market struggles it generally cannot produce, so chasing it only spends more. In those phases the rule is to contain costs and keep going, waiting for the market to offer trends again. This is a description of our method and of what our data have shown, not a prediction for any future month. We explain the same philosophy in risk reward in trend following.
Why does a small stop matter more than the choice of style?
Whichever side you pick, the same question decides your fate: how much can one wrong trade cost? In trend following the answer is built into the method. You hook onto a trend with a limited risk, if it works the move can pay many times that risk, and if it does not you lose a small, pre-defined amount. The asymmetry comes from the stop, not from being right more often. A wide-open loss turns a trend follower into someone who simply loses.
For mean reversion, the stop is even more important, because the profile is built on frequent small wins. Without a firm limit, the strategy takes the shape of the retail mistake we describe in our work: closing winners right away and letting losers run. A reversion system with a hard stop and sensible size can be a legitimate approach, but it must be designed knowing that the tail is where the risk sits.
It is also worth noting that evidence on trend following is long-lived. A well-known AQR paper, A Century of Evidence on Trend Following Investing, builds a time series momentum strategy back to 1880 and reports that it was consistently profitable over the following 110 years. That is a study of a diversified, systematic approach, not a promise for any individual trader or any single market, and strategies that worked historically can stop working.
Can you combine trend following and mean reversion?
Many practitioners argue that the two styles fail in different conditions and so could complement each other. It is a reasonable idea, but it should be handled with care. Combining two systems does not remove risk: it spreads it, and two strategies that look uncorrelated in a backtest can lose together in a stressed market. Online claims about large improvements from mixing the two often come from single backtests on one instrument, which is thin evidence.
In the community we take a more cautious path. We work from data, using strategies built with StrategyQuant, optimized with AI and backtested on roughly 9.5 years of Darwinex data, and we only move a strategy forward when its results look credible on paper and then in live research. We describe this project in directional and automated trading. A backtest describes how a strategy behaved on past data; it guarantees nothing about real or future results.
How do you choose between trend following and mean reversion?
There is no single method that works for everyone, a point that the trend following literature repeats. A few practical questions help to clarify what suits you:
- Can you tolerate losing on most trades for long stretches, knowing that the profit comes from a few big moves? If not, a trend profile will be hard to follow.
- Can you accept that a series of small wins might be wiped out by one loss, and keep a hard stop on every trade? If not, a reversion profile will be risky for you.
- How big is the loss per trade relative to your account? Position size matters more than style.
- Have you tested the idea on enough past data, including range-bound and trending years, and are you ready to treat that test as a starting point and not a promise?
If your answers lean toward patience and controlled costs, trend following fits the house method: small stops, big potential reward, and profits left to run. If they lean toward frequent small wins, mean reversion deserves the same discipline, with the tail risk treated as the main enemy.
Frequently asked questions
Is trend following better than mean reversion?
Neither is better in every market. They profit under different conditions and fail under different conditions. What decides your outcome is the loss you accept on each trade, the size of your positions and how well you test the idea, not the label of the style.
Why does trend following have a low win rate?
Because it takes many small, controlled stops while waiting for the few trends that develop. The profit comes from the size of those few winners compared with the small losses, not from winning most of the time.
Which approach suffers more in sideways markets?
Trend following usually suffers a series of small stop-outs in a sideways market, while mean reversion tends to look comfortable there. The reverse happens when a range breaks into a strong trend, which is where mean reversion is most exposed.
Does a high win rate mean a strategy is safe?
No. A high win rate with a few oversized losses can still lose money. Always read the win rate together with average win, average loss and the worst losing period. Past results and backtests do not guarantee future performance.